The new Mizar marketplace is out!
We're excited to share the news that we've upgraded our marketplace!
We've heard from many of you that you'd like a better user experience, so we decided to improve the bots' filters and sort options. Now, you can filter or sort your bots based on their performance, trader name, and much more. We also added advanced statistics so you can see how well each bot is performing over time.
We hope these changes will help make managing your bots easier than ever before!
What’s new?
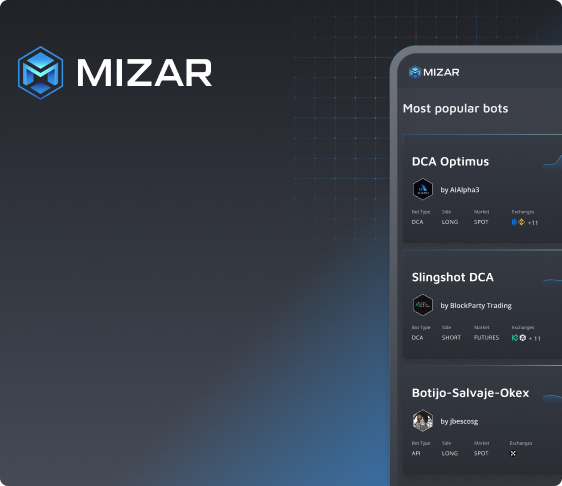
New Marketplace:
It’s more intuitive and with a cleaner look.
You can filter bots by exchanges supported, trader, market, and much more.
You can sort bots by most popular, newest bots, and more.
New performance dashboard:
It’s more intuitive and with a cleaner look.
It has more performance analytics such as the number of trades, trade distribution, holding time, and many more important indicators.
The last open and closed positions can be now seen, coupled with their performance.

Before digging into the features, let’s first catch up and explain what crypto copy trading is. A copy trading bot is a form of automated program that allows traders to copy the trades of experienced and successful traders. Traders who copy other signals are known as followers and those providing the signals are called signal providers or trade leaders. Mizar is the best copy trading platform where users can copy trade without upfront payments or fixed fees. After connecting to your exchange (such as Woo X or Bybit), you can visit the marketplace, select a strategy, and copy trade crypto in a few clicks. Copy trading crypto has never been easier.
Marketplace - what are the main improvements with respect to the previous version?
We're always looking for ways to make Mizar's experience better. That's why we added a new filtering and sorting system that will help you find your favorite strategies in the easiest way possible.
Filtering: you can now filter the bots in the marketplace and select the bot type, supported exchanges, name of the trader, market, and trading pairs.
Sorting: you can now sort the bots based on different criteria, such as the most performing bots in the last 30 days, the most popular bots, and the newest and oldest bots.
Bots stats - understanding risks and bot behavior has become easier than ever.
Finding the right crypto bot for you is a big deal. But understanding how that bot behaves and evaluating if that's exactly what you're looking for is even more important. Mizar has developed an extensive dashboard where users can understand the bot's performance by looking at analytics.
The statistics are divided into 2 main categories: performance and positions.
Performance
On the performance page, you can get a glance at important indicators such as generated profits, number of trades executed, risk, and much more.
First of all, by looking at the history of the generated returns per calendar month, you can get an idea of what to expect from a bot in terms of returns. Of course, this indicator refers to the past, and no one can predict what will happen in the future. But it could still give you an idea!
Secondly, you can take a look at the trading activity. You can understand how many trades have been executed over a selected time period, see how many of them were closed in profits and how many in loss, and even look at their frequency. The frequency gives you a rough idea of what to expect in terms of trading volume and also helps you to understand if your bot is behaving as the one you’re copying.
As every bot trades different pairs, it’s also important to understand how it differentiates its trades among different assets. By checking the trade distribution you can see which tokens have been actually bought or sold, take a look at their distribution weighted on volume, and see the returns of each of them.
If you want to understand how long your trades will be open, then you can take a look at the holding time statistics. The holding time refers to the time when a trade is kept open. This will give you an overview of how long you will be exposed to the market. Additionally, it gives you a rough estimate of how capital efficient the bot is, in the sense that it tells you how long you should deploy your capital to reach a certain goal (take profit) or to close at loss to cut your risk.
As risk management is one of the most essential things in trading, Mizar offers some indicators to help you to measure it. A DCA bot is a trading bot that enables you to mitigate your risk by buying or selling more assets if the price goes against your initial assumptions. DCA bots for crypto help you improve your average entry price when things do not go as planned. By looking at how many extra orders (Safety Orders) have been executed from the time the first order has been opened, you can understand how often it happens that the DCA trading bot needs to correct itself before closing the trade. This can give you a rough idea of what to expect in terms of risk management and how much capital you should be ready to deploy to reduce volatility risks.
Positions
For some users, it’s also important to understand what trades have been executed over a certain period of time and to see which positions are currently open. We can explain what an open position is with an easy example. If you buy 100 USDT of BTC, then you open a long position on BTC. As the price moves from your entry point, you will generate an unrealized profit and loss (sometimes called virtual profit and loss). If you sell back the BTC you previously bought (100% of it), then the position will be closed. In this case, based on the close price, you will realize a profit and loss.
Looking at the current open positions you can understand how many positions are open and see how they are performing. Sometimes it’s important to understand how long those positions are open. Hanging positions (positions that are open for a long time) are normally a negative indicator, as it means you need to commit part of your capital for a long time before realizing your profits (or eventually close at loss).
The last 100 positions' history gives you instead an idea of what pairs have been traded, and how much profits have been generated. You can also use this as a benchmark to see if your bot is behaving exactly like one of the traders you’re following.
What’s next?
Now that you've learned how to evaluate a strategy, you're ready to invest some of your capital (be careful, invest only what you can afford to lose!). Mizar Copy Trading is very simple: just allocate some USDT to a bot, and let it do the hard work for you. Read our tutorial to learn how to copy trade on Mizar.