Technical Analysis: Mastering Chart Analysis Techniques to Take Informed Trading Decisions

Chart analysis is used by traders to analyze financial market data, identify patterns and trends, and make informed trading decisions. It involves the use of various techniques, including trend lines, support and resistance levels, and technical indicators, to predict future price movements of assets. While chart analysis can be a powerful tool, it is important to remember that none of these principles are bulletproof and should be used in combination with other methods, such as fundamental analysis.
Key Takeaways:
Chart analysis encompasses trend lines, support and resistance levels and technical indicators and is used to analyze financial market data to identify patterns and trends that can help predict future price movements.
Trend lines are lines drawn on a price chart that connect two or more price points to show the direction and strength of a trend.
Support levels are price levels where buying pressure increases, and resistance levels are where selling pressure increases, resulting in price reversal.
Technical indicators are mathematical calculations based on historical price data that use an asset's price and/or volume to predict future price movements.
In the last article we talked about the importance of Technical Analysis. In this article, we'll take a closer look at the basic principles of chart analysis and how traders can use them to make profitable crypto trading decisions. Bots can be programmed to recognize specific patterns and execute trades based on them. By automating this process, traders can quickly respond to favorable market conditions without having to constantly monitor charts themselves. (Read what a crypto trading bot is here.)
What are trend lines:
In chart analysis, trend lines are lines drawn on a price chart that connect two or more price points to show the direction and strength of a trend. Trend lines can help traders identify potential entry and exit points. There are three main types of trend lines that traders commonly use:
Upward trend line: This is a line drawn along the bottom of price movements that are moving higher over time. The upward trend line is used to identify an uptrend in the market.
Downward trend line: This is a line drawn along the top of price movements that are moving lower over time. The downward trend line is used to identify a downtrend in the market.
Sideways trend line: This is a line drawn along the peaks and valleys of price movements that are trading in a range. The sideways trend line is used to identify a range-bound market where prices are not trending up or down.
What are support and resistance levels:
Support and resistance levels are price levels where buying or selling pressure is concentrated, resulting in price reversals. Traders can use these levels to identify potential entry and exit points.
A support level is a price point at which the asset has historically found support and bounced back up, rather than breaking down further. So instead of prices falling further they either reverse direction or consolidate before moving higher. These levels are often seen as a “floor” below which the price of an asset is unlikely to fall, as buying pressure usually increases as the price approaches the support level.
A resistance level is a price point at which the asset has historically found resistance and failed to break through, causing prices to reverse direction or consolidate before moving lower. These levels are often seen as a “ceiling” above which the price of an asset is unlikely to rise, as selling pressure usually increases as the price approaches the resistance level.
How to identify support or resistance levels?
Support and resistance levels can be identified using chart analysis (e.g. moving averages, trend lines, chart patterns). For example trend lines can be used to identify areas of support where the price tends to bounce back up after reaching the line, and resistance where the price tends to pull back after reaching the line. Additionally, chart patterns such as double tops or triple tops can indicate resistance levels, as these patterns show that the asset has failed to break through a certain price point multiple times in the past.
How can you use support and resistance levels in trading?
Traders and investors can use support and resistance levels to make informed trading decisions.
If the price of an asset is approaching a support level, a trader may decide to buy the asset because the price is less likely to continue falling below the support level. If an asset manages to bounce back from a support level, it can be a bullish signal that the price is likely to continue rising. Alternatively, if the price of an asset breaks below a support level, a trader may decide to sell the asset because they believe that the price is likely to continue falling. Traders can manage their risk by setting stop-loss orders at or below these levels and automate their DCA trading bots accordingly. Crypto trading bots that are programmed the right way help protect against significant losses.
Traders can use resistance levels to make informed decisions about when to sell an asset, as the price is less likely to continue rising beyond the resistance level. Additionally, if an asset manages to break through a resistance level, it can be a bullish signal that the price is likely to continue rising.
What are technical indicators?
Technical indicators are tools traders use to help them analyze the stock market and identify patterns, potential trends and reversals in the market so that they can make informed decisions about buying and selling stocks.
Technical indicators are mathematical calculations based on historical price data that use an asset's price and/or volume to predict future price movements. They can be used to ensure that crypto trading bots will enter or exit the market at the optimal time for example.
Some common technical indicators are:
Moving averages: Used to identify the average price of an asset over a given period and to determine support and resistance levels.
Relative Strength Index (RSI): Used to measure the strength and speed of price movements to determine if an asset is overbought or oversold.
MACD (Moving Average Convergence Divergence): Used to identify changes in momentum and potential trend reversals by comparing two moving averages.
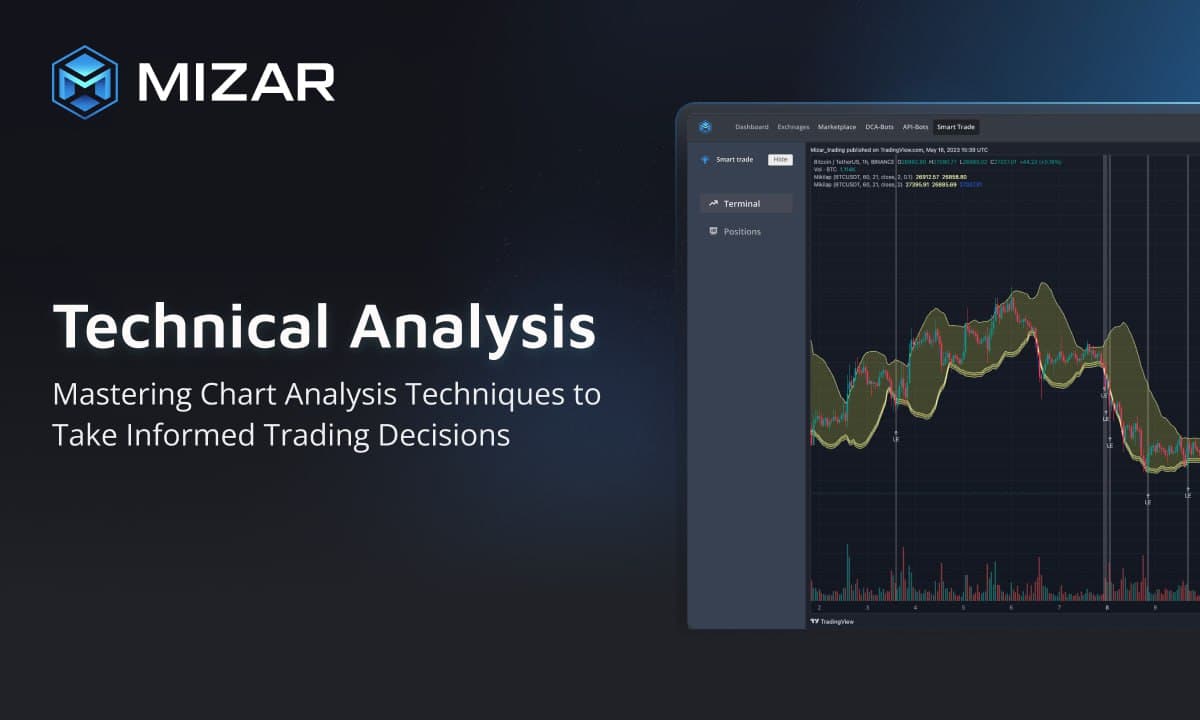
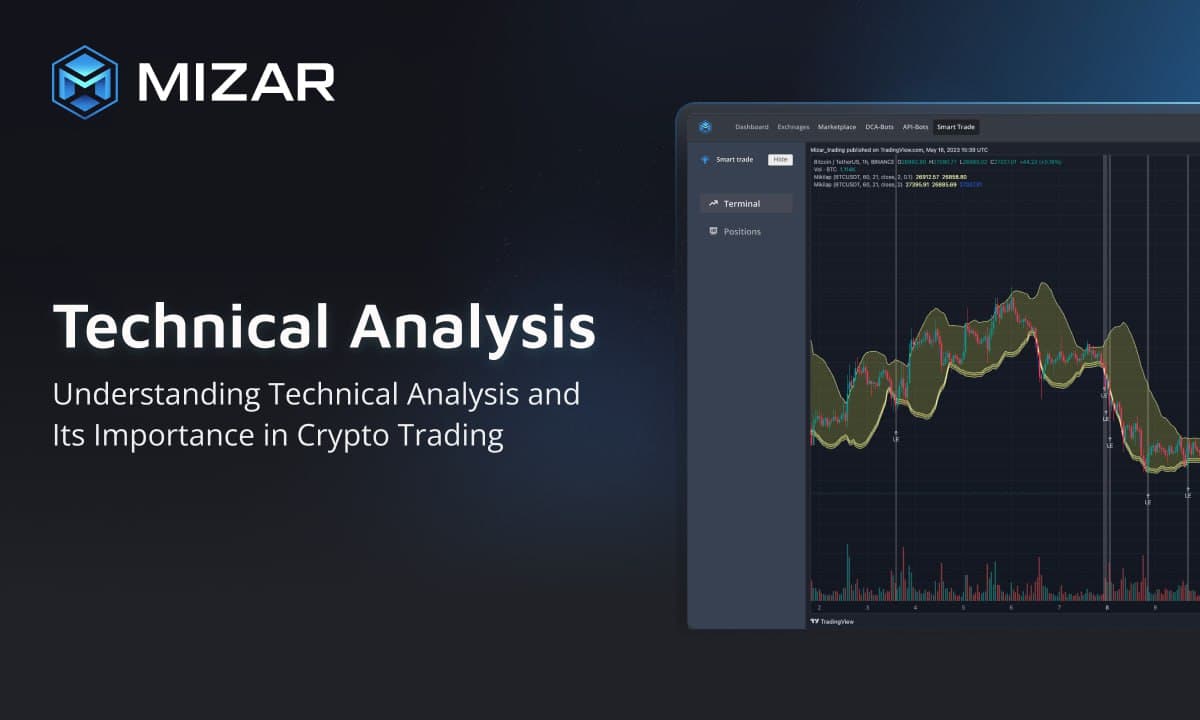
Bollinger Bands: Used to measure volatility and potential breakouts to determine buying and selling opportunities based on the width of the bands.
Conclusion:
In conclusion, chart analysis is an important tool used by traders and investors to identify patterns and trends that can help predict future price movements. Trend lines, support and resistance levels, and technical indicators are the three basic principles of chart analysis that traders use to make informed decisions about buying and selling assets. While chart analysis can be a powerful tool, it should be used in conjunction with other analysis methods, such as fundamental analysis and market sentiment analysis, to make informed trading decisions. Ultimately, successful trading requires a combination of knowledge, skill, and experience, and traders should always manage their risk by setting stop-loss orders and following a well-defined trading strategy.
With the Mizar Smart Trading Terminal everyone can set up their automated crypto trading bots following these principles. Traders that do not have the time or experience to self-trade can easily do crypto copy trading and search for the best DCA bot strategies in the Mizar marketplace.
In the next article we will tap into the world of technical indicators and focus on Bollinger Bands in particular.


